
 Eric Jorge Seguí Parejo

Google Analytics is a tool I’m quite fond of because of all the features it offers that many people don’t know about. You can even upload data!
The worst part is that hardly anyone uses this.
Often it’s down to not knowing about it or not having the time, because uploading this data usually involves some kind of manual task, although, to be fair, it can also be sent via API. Yes, you read that right, via API.
Unfortunately I’m not going to tell you how to automate this upload via API; I’m going to show you the manual way. Maybe I’ll talk about it another day «but today is not that day» -> Lapse moment:
Coming back from the epic lapse moment, let’s get down to it, but I have to warn you…
Stay until the end!
Why?
Surpriiiise! Although you can see the spoiler in the headings.
Uploading data
The first thing you need to do is go to your Google Analytics account, under Admin, and in the Property column you’ll find an option at the bottom called data import.
Click on it and add a new option with the huge red button that says Create.

You have several options to choose from, for refunds, content, products, etc. Select Cost Data, which is the one I’ll show you, and afterwards you can let your creativity run wild with the rest.
Next you need to give it a name. I called mine Coste, but call it whatever you like.
In the next step you’ll select the metrics and dimensions you’re going to upload. Some come by default and are mandatory, while others are optional or mandatory and you can decide whether you want to include them.

The first three dimensions (date, medium and source) are mandatory. After that you’ll have another option where it’s also mandatory to select at least one of the choices, and you’ll also need to include that data.
The third set of data is optional, but you can also use it to pass on more information. This will depend on how deep you need to go.
Then you have two options for saving the data, where you can choose to overwrite the data or add it up if the keys match. In this case you’ll select overwrite.
Save and open your new data import option (as if you were going to edit it), and you’ll see a button that says get schema. This option tells you how the data must be laid out in the CSV in order to upload the file with the information; in other words, clicking the button downloads a sample CSV file.
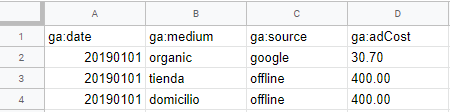
It’s important that the file is uploaded as a CSV, that the dimensions match exactly how they appear in Analytics and that every source/medium you enter is assigned to a channel. Here’s an example so you can see how the data should be uploaded:
To upload all the information to Google Analytics, open the option you created (the one I called Coste) and on the right you’ll find the Manage uploads option.
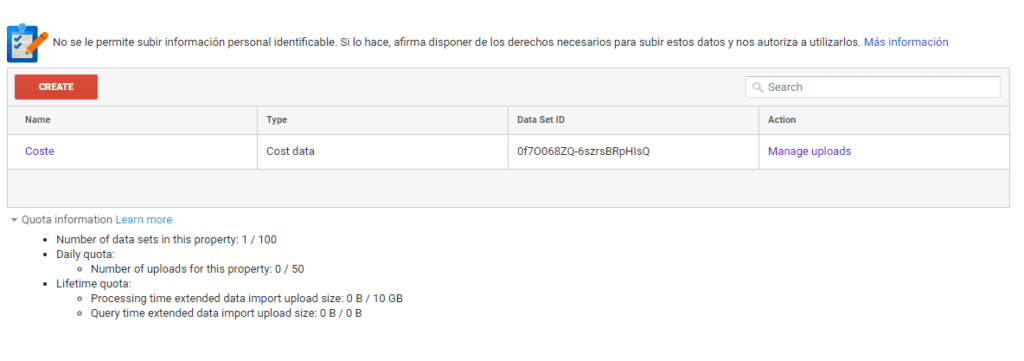
Once you’re in, you’ll see the big red button again, but this time it will say Upload file. I think you know what to do from here, you are the chosen one.
Cheeky tricks
The time has come. Since you’re one of the chosen few who made it to this point in the article, I thought that instead of one tip I’d give you two. You’ve stuck with it this far, so you deserve it.
Custom channels in Google Analytics
I don’t know if you’re aware that in Google Analytics you can create your own channels so you can see the data in a more segmented way. When I say Channels, I mean this:
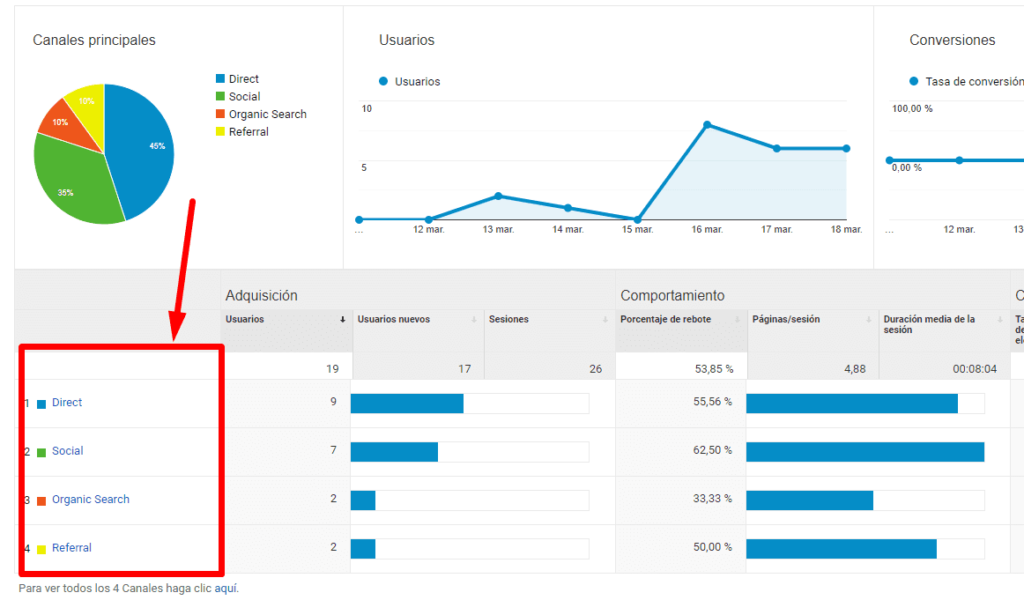
Customising this is done at Google Analytics view level. If you have lots of views, you’ll have to apply it to all of them, either manually or by exporting it to the other views.
To customise and create your own channels, go back to Admin and, in the View column, under Channel Settings, choose Channel Grouping.
Here you can edit an existing one or create a new one. I usually edit the existing one; I haven’t yet reached the point of needing a new one, but it’s quite possible that sooner or later I will.
When you go in to edit your Default Channel Grouping, you’ll see something like this:
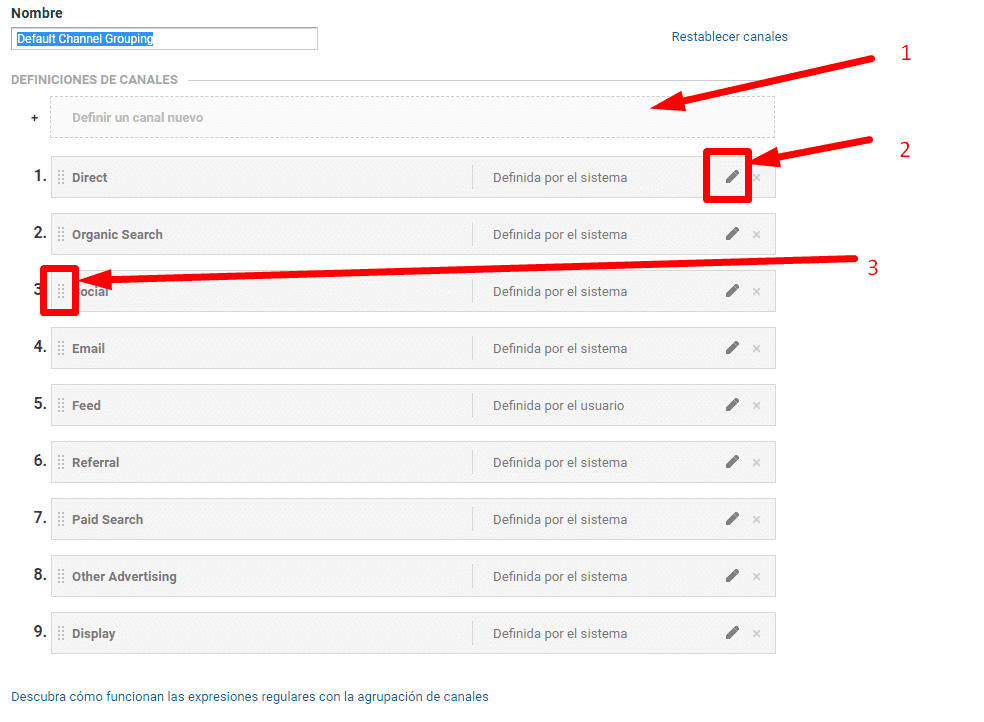
Right, let me explain what each highlighted option is for:
- It lets you add new channels. Clicking this option gives you several filters for identifying the channel.
- The pencil lets you edit each channel in case you need to add new segmentation options or edit one of the channels.
- These dots are used to change the order of priority. This matters, because visits are assigned to one channel or another according to priority when they conflict.
- The fourth point isn’t highlighted because it’s fairly obvious and I wasn’t going to explain it, but in case you haven’t worked it out, the cross (X) is for deleting the row.
Right, so now that you know how to upload manual data, here are a few ideas of what you can upload that could genuinely be useful: cost data from other advertising campaigns or investments, the physical visits to your shop, the costs of your bricks-and-mortar shop, the transactions made, revenue, etc.
This way you can have all your information, both online and offline, synchronised in a single piece of software.
Sending data to Google Analytics in the background via URLs
This is something I learnt quite a while ago and it’s really interesting, because if the API is a bit too complex for you, this is a relatively simple option. What it does is send the data to Google Analytics through URL variables.
This could be useful for «trolling» hehehe, but no, don’t think about mischief, I know wicked ideas are crossing your mind right now. The idea behind this is to be able to send data from external requests.
Here’s the documentation. If you build a URL and run it in your browser, it should send information in real time to your Google Analytics account. Here’s an example (remember to change the UA-xxxxxxxx-Y):
https://www.google-analytics.com/collect?v=1&tid=UA-xxxxxxxx-Y&cid=5555&t=pageview&dp=%2FQueseo-Say-Cheese
I remember using this back in the day with CURL PHP, although I can’t quite remember what for.
A few quick use cases that spring to mind:
- A comparison website that has signed up several portals. It runs this option to send impression and click data for the compared products to external portals.
- Sending information from one of your websites to another to compare clicks and sessions.
- Sending data from a CRM or your till to Google Analytics.
And that’s it
I think these tricks are pretty cool for today’s article. Now all you have to do is let your creativity run a little wild.
Think about features and how you can apply all this on a big scale.
Tracking impressions from people looking at a camera and grouping them into a channel? Analysing the people who walk into an offline shop with some kind of sensor that sends the information, and automatically combining it with your shop’s sales at the end of the day?
It may seem very creative or pure fantasy, but I’m telling you it can already be done, and it is being done.
As always, if you liked the article, I’d be very grateful if you shared it, and if you want to get in touch, you can do so through social media =)

Technical SEO consultant in Valencia for more than 16 years. Speaker and organiser at WordCamp Valencia and author on the Semrush and Publisuites blogs. More about me